
The shortest¹ cycling route that climbs the top 100 climbs in the continental US.
The idea
A while back, Randal Olson posted a blog post about the optimal road trip across the US. The parameters of his project were to design a car trip that touched all the states, and he used landmarks in each state to make it more interesting.
Two things really stood out about this to me:
- he open-sourced his notebook that wrapped up some of more annoying API/wrapper stuff and the genetic algorithm
- he noted that the API accepted a
bike routesflag!
I was inspired! In addition to a mathy, I’m a serious lover of cycling. My project, was essentially:
Combine the dataset of Top 100 road cycling climbs with Randal Olson’s project to achieve the minimal bike route that includes all these climbs.
The Top 100 road climbs is a nice project by pjammcycling that rank the hardest climbs in the US(as defined by Fiets index).
Note: I wanted this to be a cycling route, no usage of boats allowed. So Hawaii was out. Unfortunately—and somewhat surprisingly, Hawaii has 7 of the top 100 road climbs in the US. Luckily, the list provided 107 climbs, so…

A little about the math
More details are in Randy’s post, but I’ll provide a super short explanation of the idea.
This is the famous Traveling Salesman Problem which finds the order that minimizes the distance to visit a collection of sites.
In our case, the starts of the climbs are the sites. We use Google Maps API to find cycling routes between each pair of sites(that’s 10000 measurements).
Once you have all the pairwise distance it would require n! or 10000!(this is over 35000 digits) different orderings you’d have to try. We use something called a genetic algorithm which picks a random order, changes some and checks if it improves or worsens. After many many iterations it comes to a good, but not necessarily perfect solution¹.
Some challenges
Initially, I was going to grab the list of locations names from pjamm, run them through his notebook, and let it crunch. But I was wary that things weren’t going to be easy, because the names of the locations weren’t very accurate.
My first round yielded a route that the Google Maps visualization API couldn’t plot because many of the locations it couldn’t find anything for. I switched to (lat, long) after a few small modifications to his notebook. This worked much better at getting me close to the initial points for each of the climbs.
Again, the visualization code died on this route. This time, it was a mixture of some bad waypoints, and a few other things:
- the route was longer than the maximum alloted
- some locations were on roads that are not bike friendly so Google maps disliked this
- some locations were connected by seasonal roads, so Google maps disliked this (this issue returns later)
Google Maps visualizations
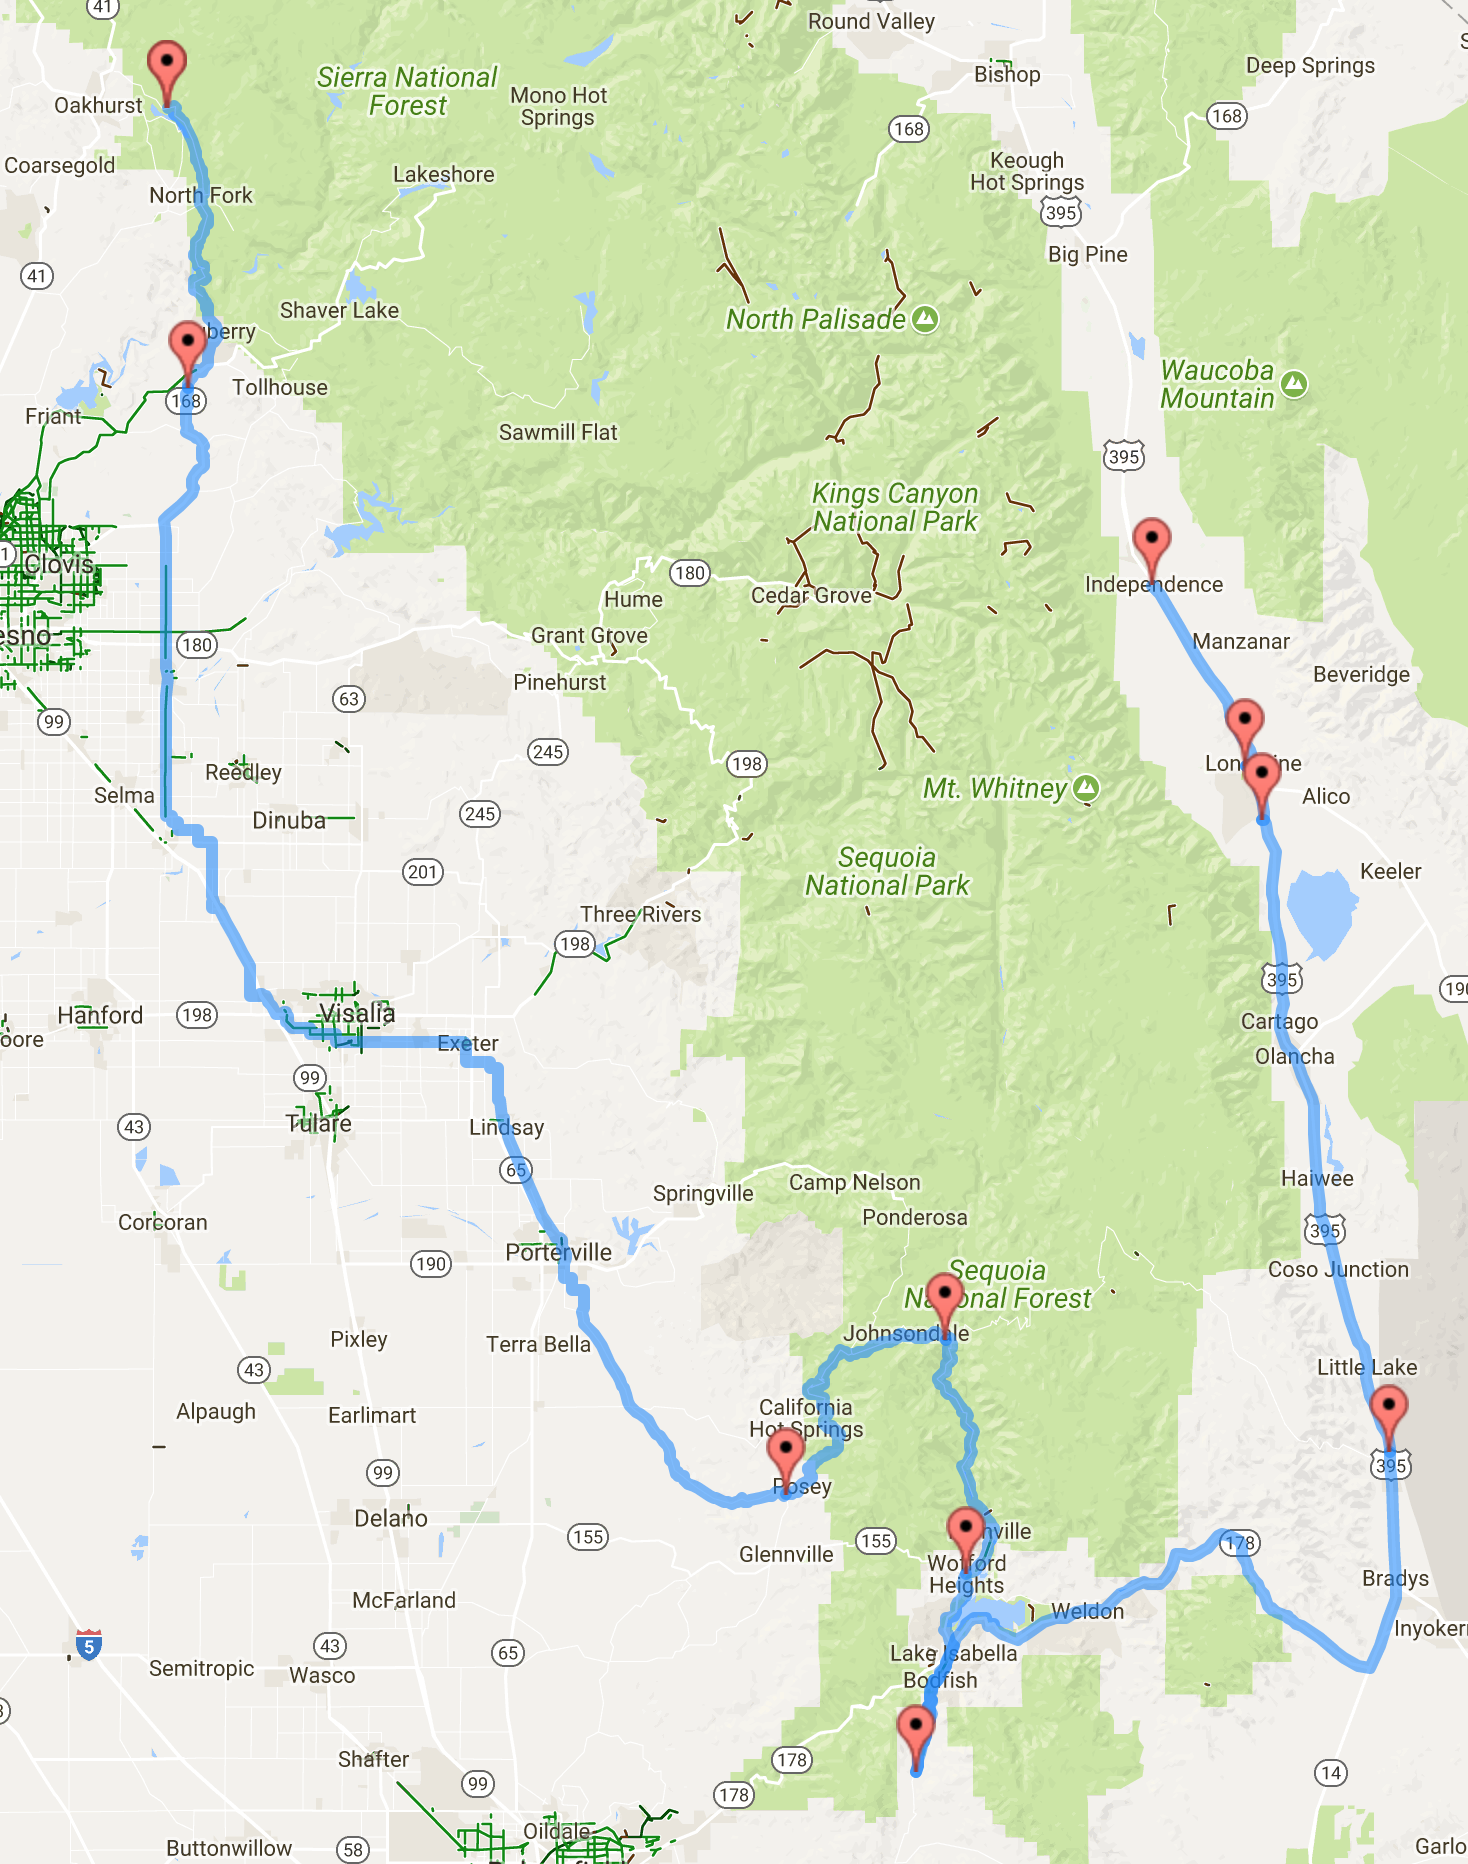
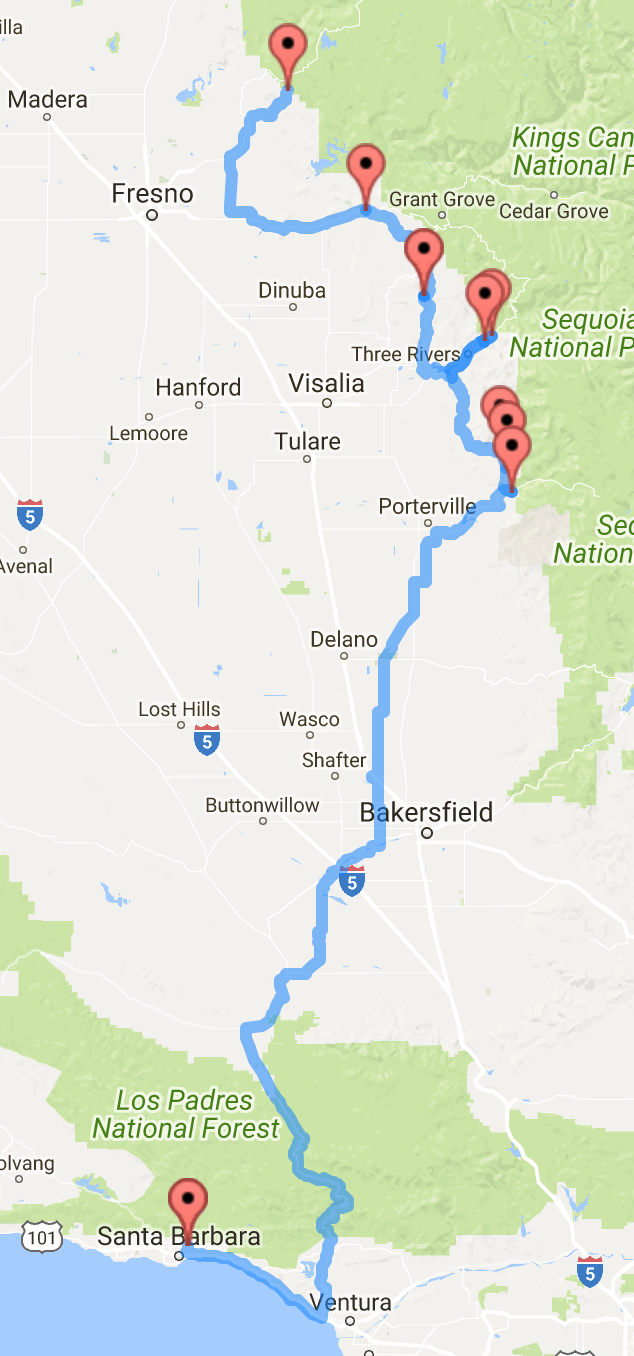
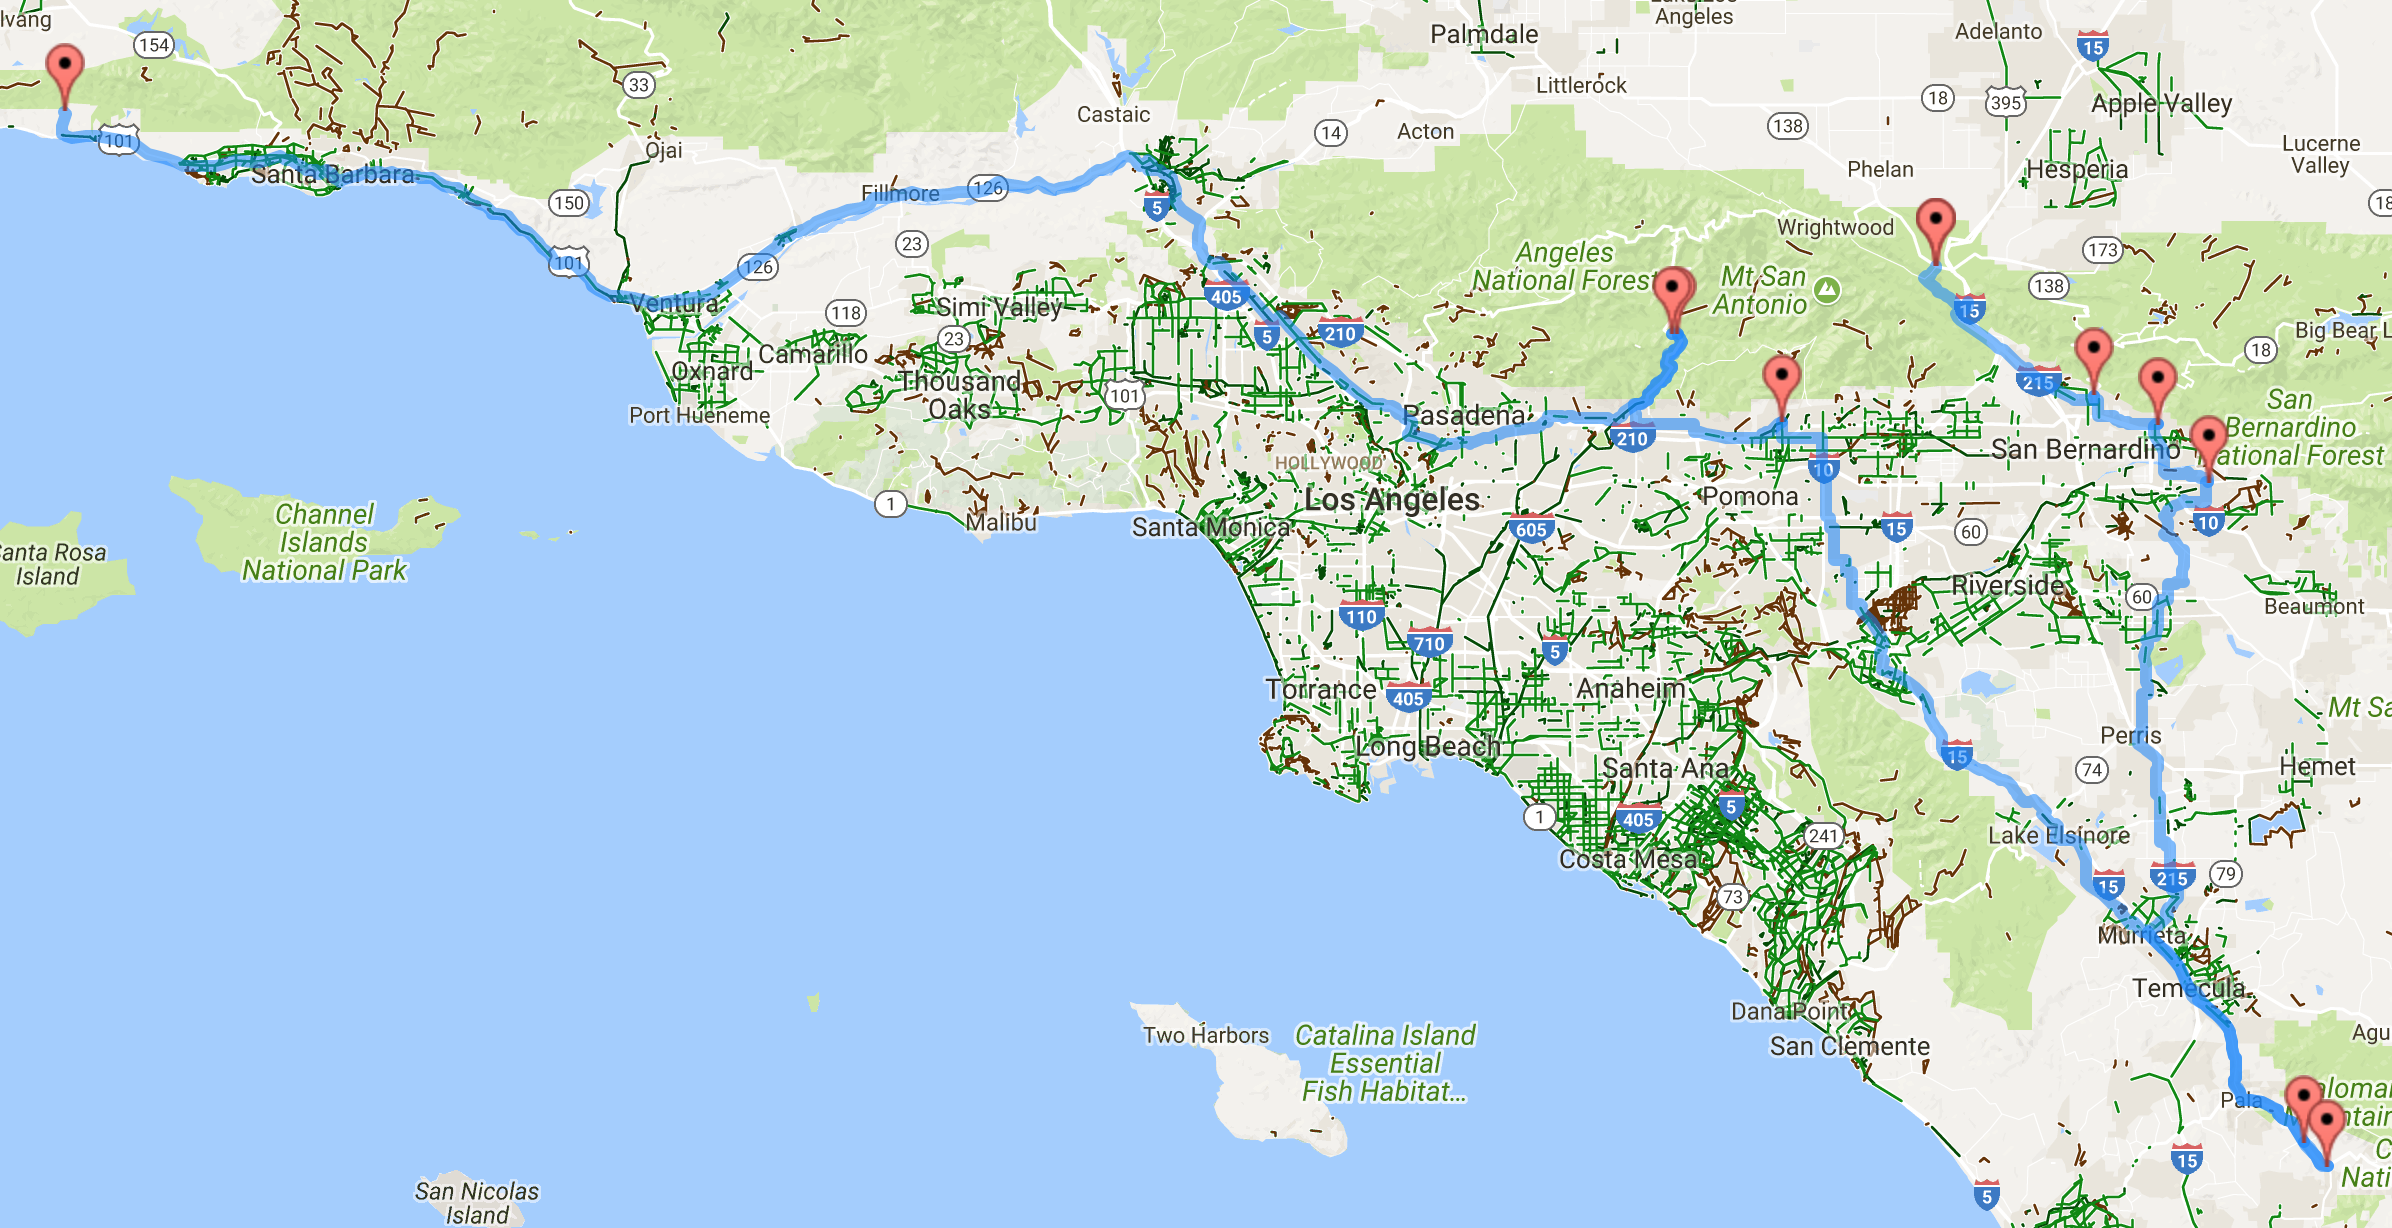
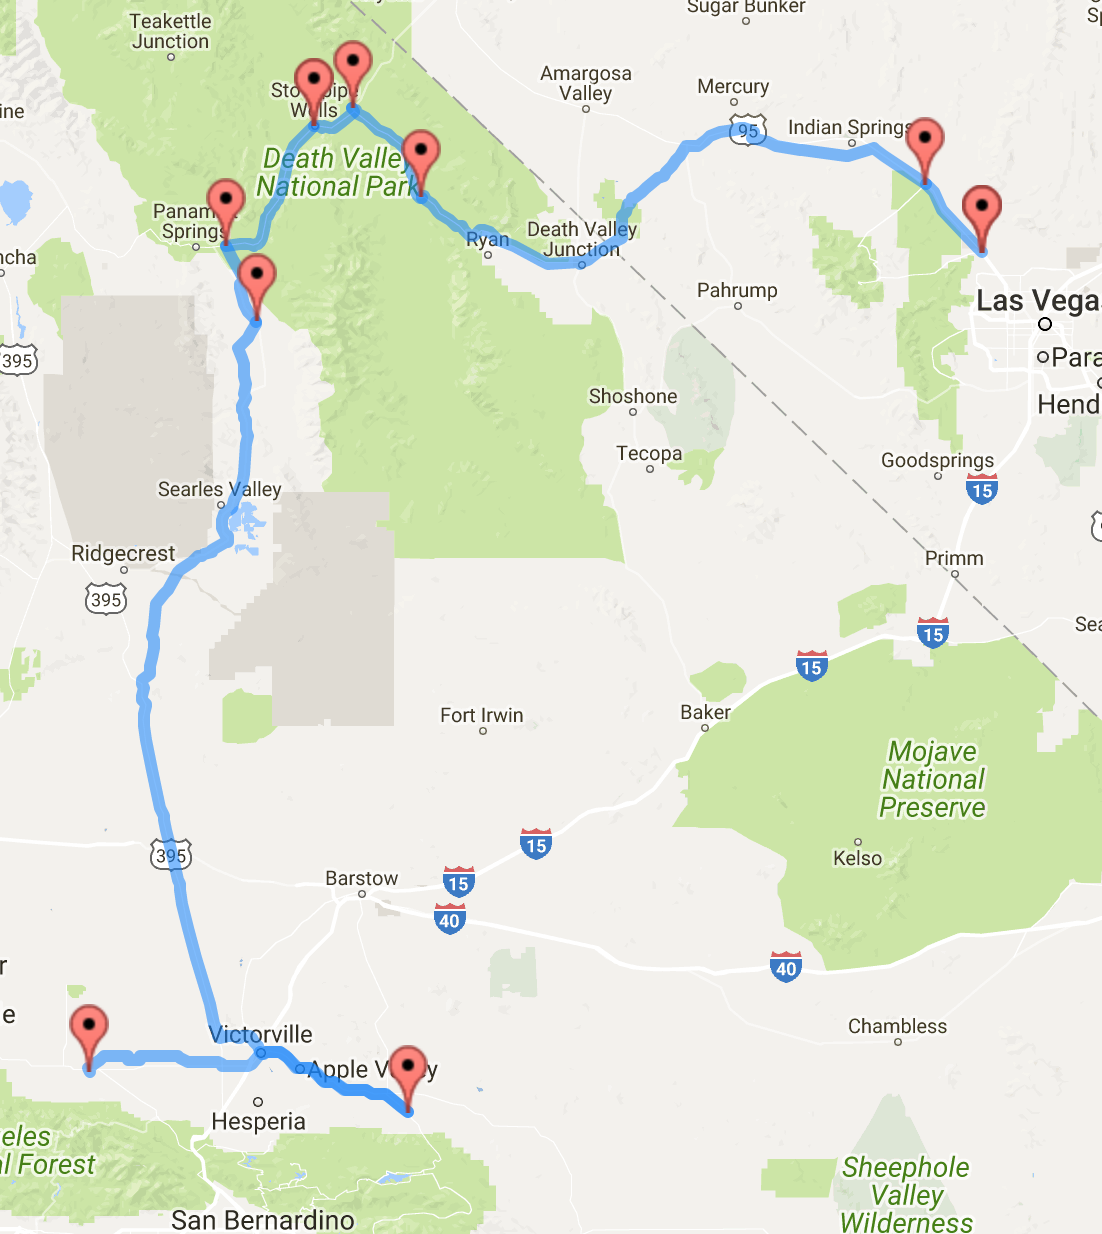
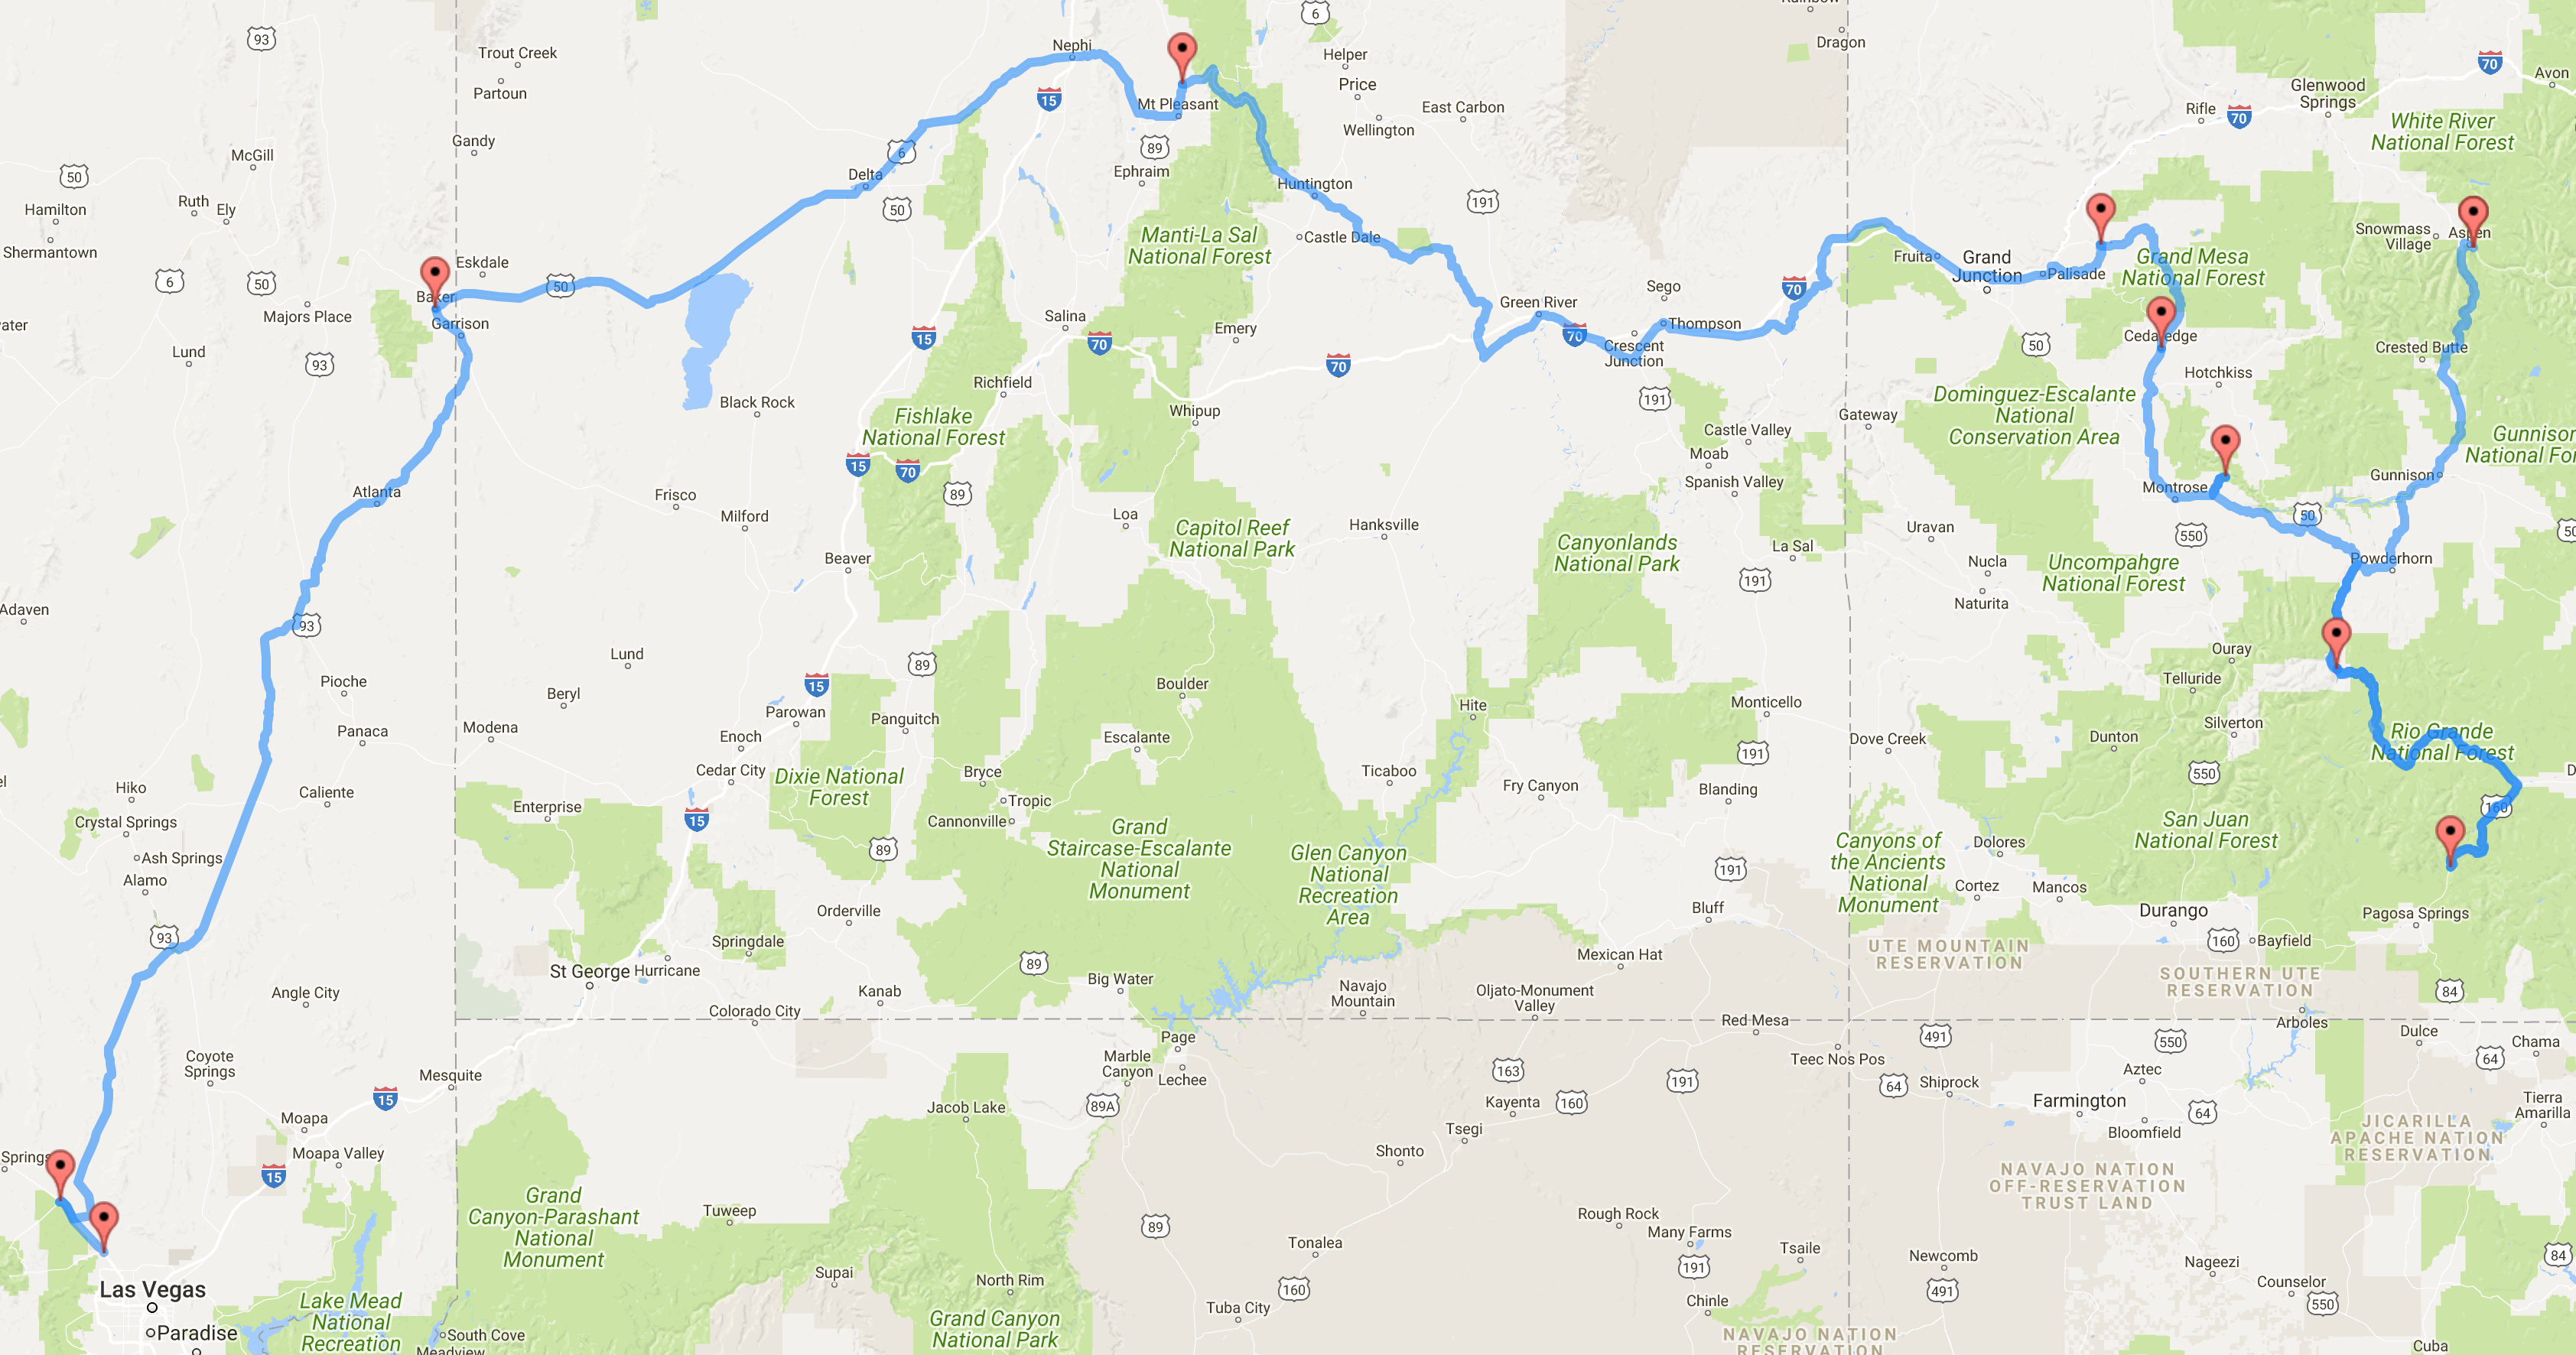
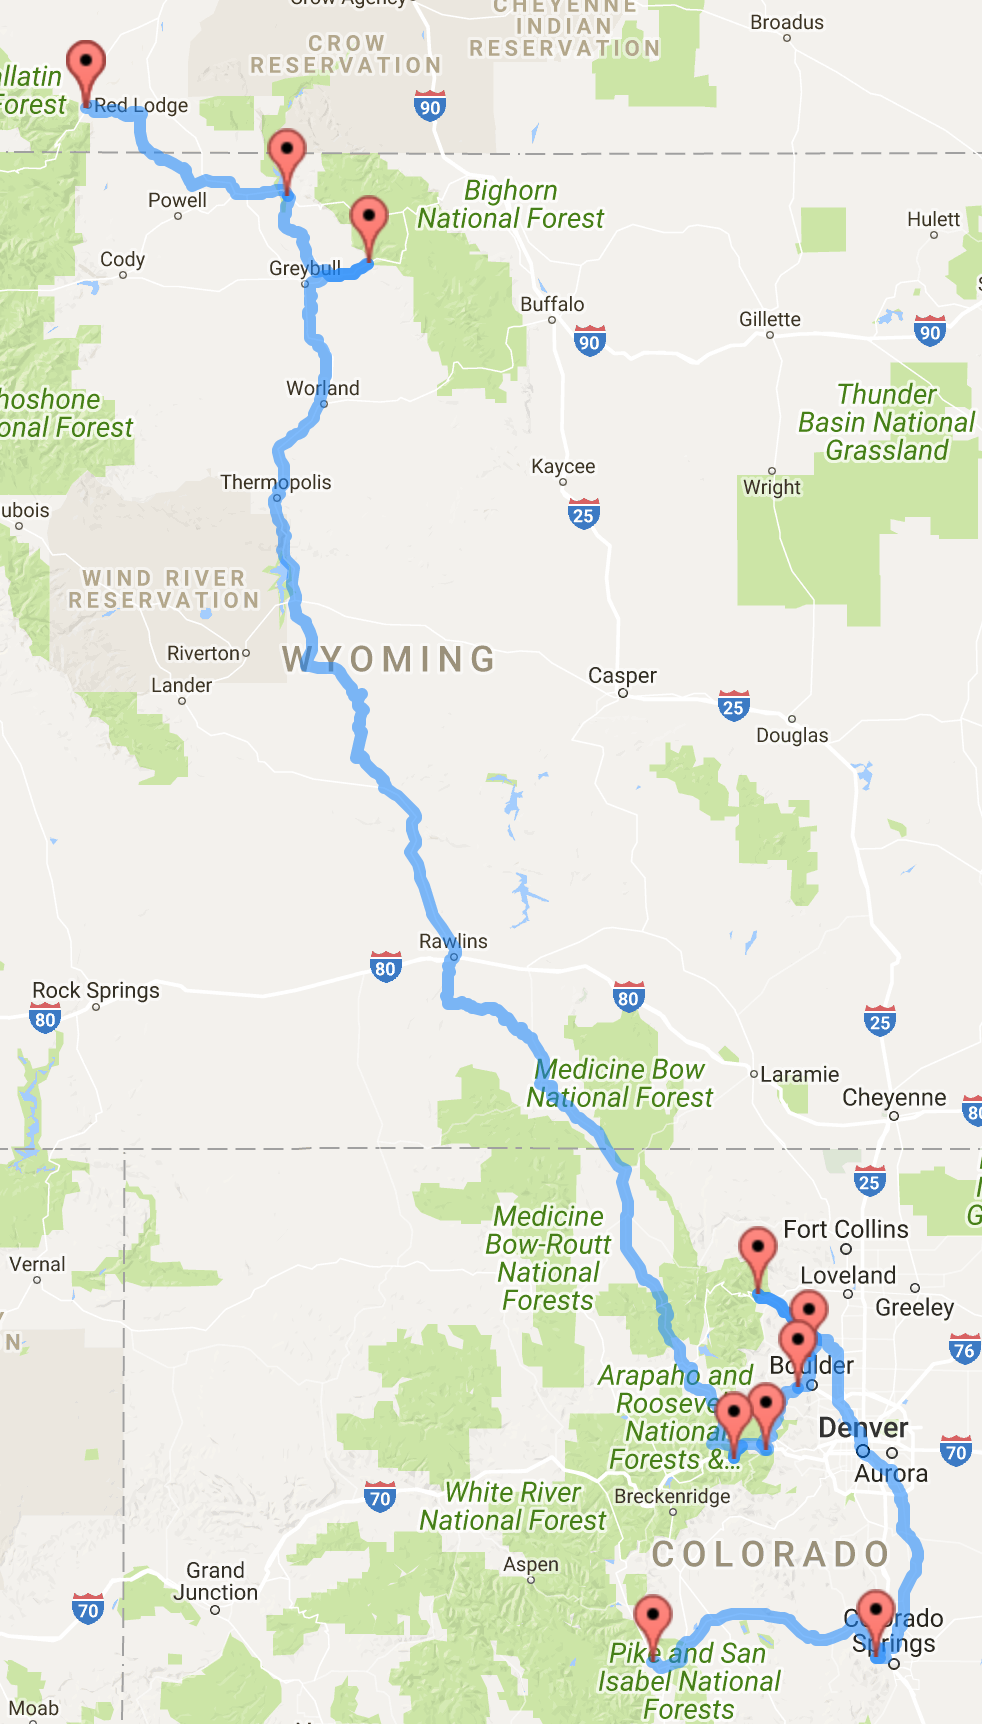
I managed to do some small adjustments and finally get an image for this stage of the visualization, knowing that there was much more to do. I also broke the route up into ten pieces, anticipating the difficulties due to scale.
Transitioning to an actual cycling route
I always wanted this to turn into a cycling route in the end, and the numerous issues with the Google maps visualization made clear that things wouldn’t go smoothly. About this time I came to some scary realizations:
- the data that I had didn’t include the actual climbs, they were simply latitude and longitude of the starting location
- I didn’t have the Strava segments associated to each of these climbs
- I couldn’t find a route builder that accepted lists of coordinates to build a route, and Strava doesn’t allow adding waypoints later, or searching by lat/long in their route builder.
At this point, I took a major step back. The relatively naive approach I was taking had come to an end. I then started working on building more of a decent dataset.
The dataset
Until this moment I’d been able to simply copy the table off the front page (Note that the website has changed a bit recently) , and with some text-editor dexterity, turn it into something that looked like a data set. Now, I knew I needed to do a few things:
- scrape the dataset and make sure it was clean and more easily referenced
- download the Strava segments for each climb and add the segment number to my dataset
These were relatively straightforward, here’s how I grabbed the segments:
printf "1, " >> enum_outputstrings.txt
curl -s "https://www.pjammcycling.com/1.--mauna-kea---test2.html" | grep www.Strava | awk 'BEGIN {FS="src="} {for(i=2;i<=NF;i++)print $i}' | cut -d ">" -f 1 | tr -d \'\" | sed -e 's/\/embed$//'  >> enum_outputstrings.txt
I was feeling good about this and started the next step—which I’ll explain in a minute—before I realized a huge problem with this.
If you look closely at how I’m extracting the above, I’m using a few tricks about the order that I download them, to infer the number in the ranking, and then searching that page for where I see the string www.Strava. Why is this a problem? Because pjammcycling has changed the order without updating the urls… Also, my original code wasn’t clever enough to predict pages with multiple Strava links.
Both of these meant that this data extract was quite seriously erroneous. This wouldn’t have been particularly awful, had I been using a more sophisticated method for this data extraction. The subtlety really ended up being the killer. I ended up not really updating the shell script, and instead just manually adjusted things, or used some text-editor shenanigans.
This was the first part of the problem that pushed the timeline way back.
Plotting the route
I still hadn’t found a solution to either of my plotting problems. So, I thought to myself:
“I’ll buckle down and input all these lat/long by hand”
Luckily, I had the foresight to split them into ten-climb groups. It took about an hour, but I build the original ten routes, by copy-pasting lat/long pairs into ridewithGPS.
A note about ridewithGPS: I think that I’d more naturally use Strava to build the route, because all of the climbs have the effort data, but ridewithGPS’ route tool is hands-down easier to use, and allows for addition of waypoints, splitting, combining, etc. I’m not confident this project would be possible with Strava’s route tool, but doable with ridewithGPS’.
So now I have ten long routes that connect the starting points of each climb, but I’m a long way from the actual goal. This came after some manual adjustment here and there, where the points were problematic as I previously mentioned.
A brief aside about loops
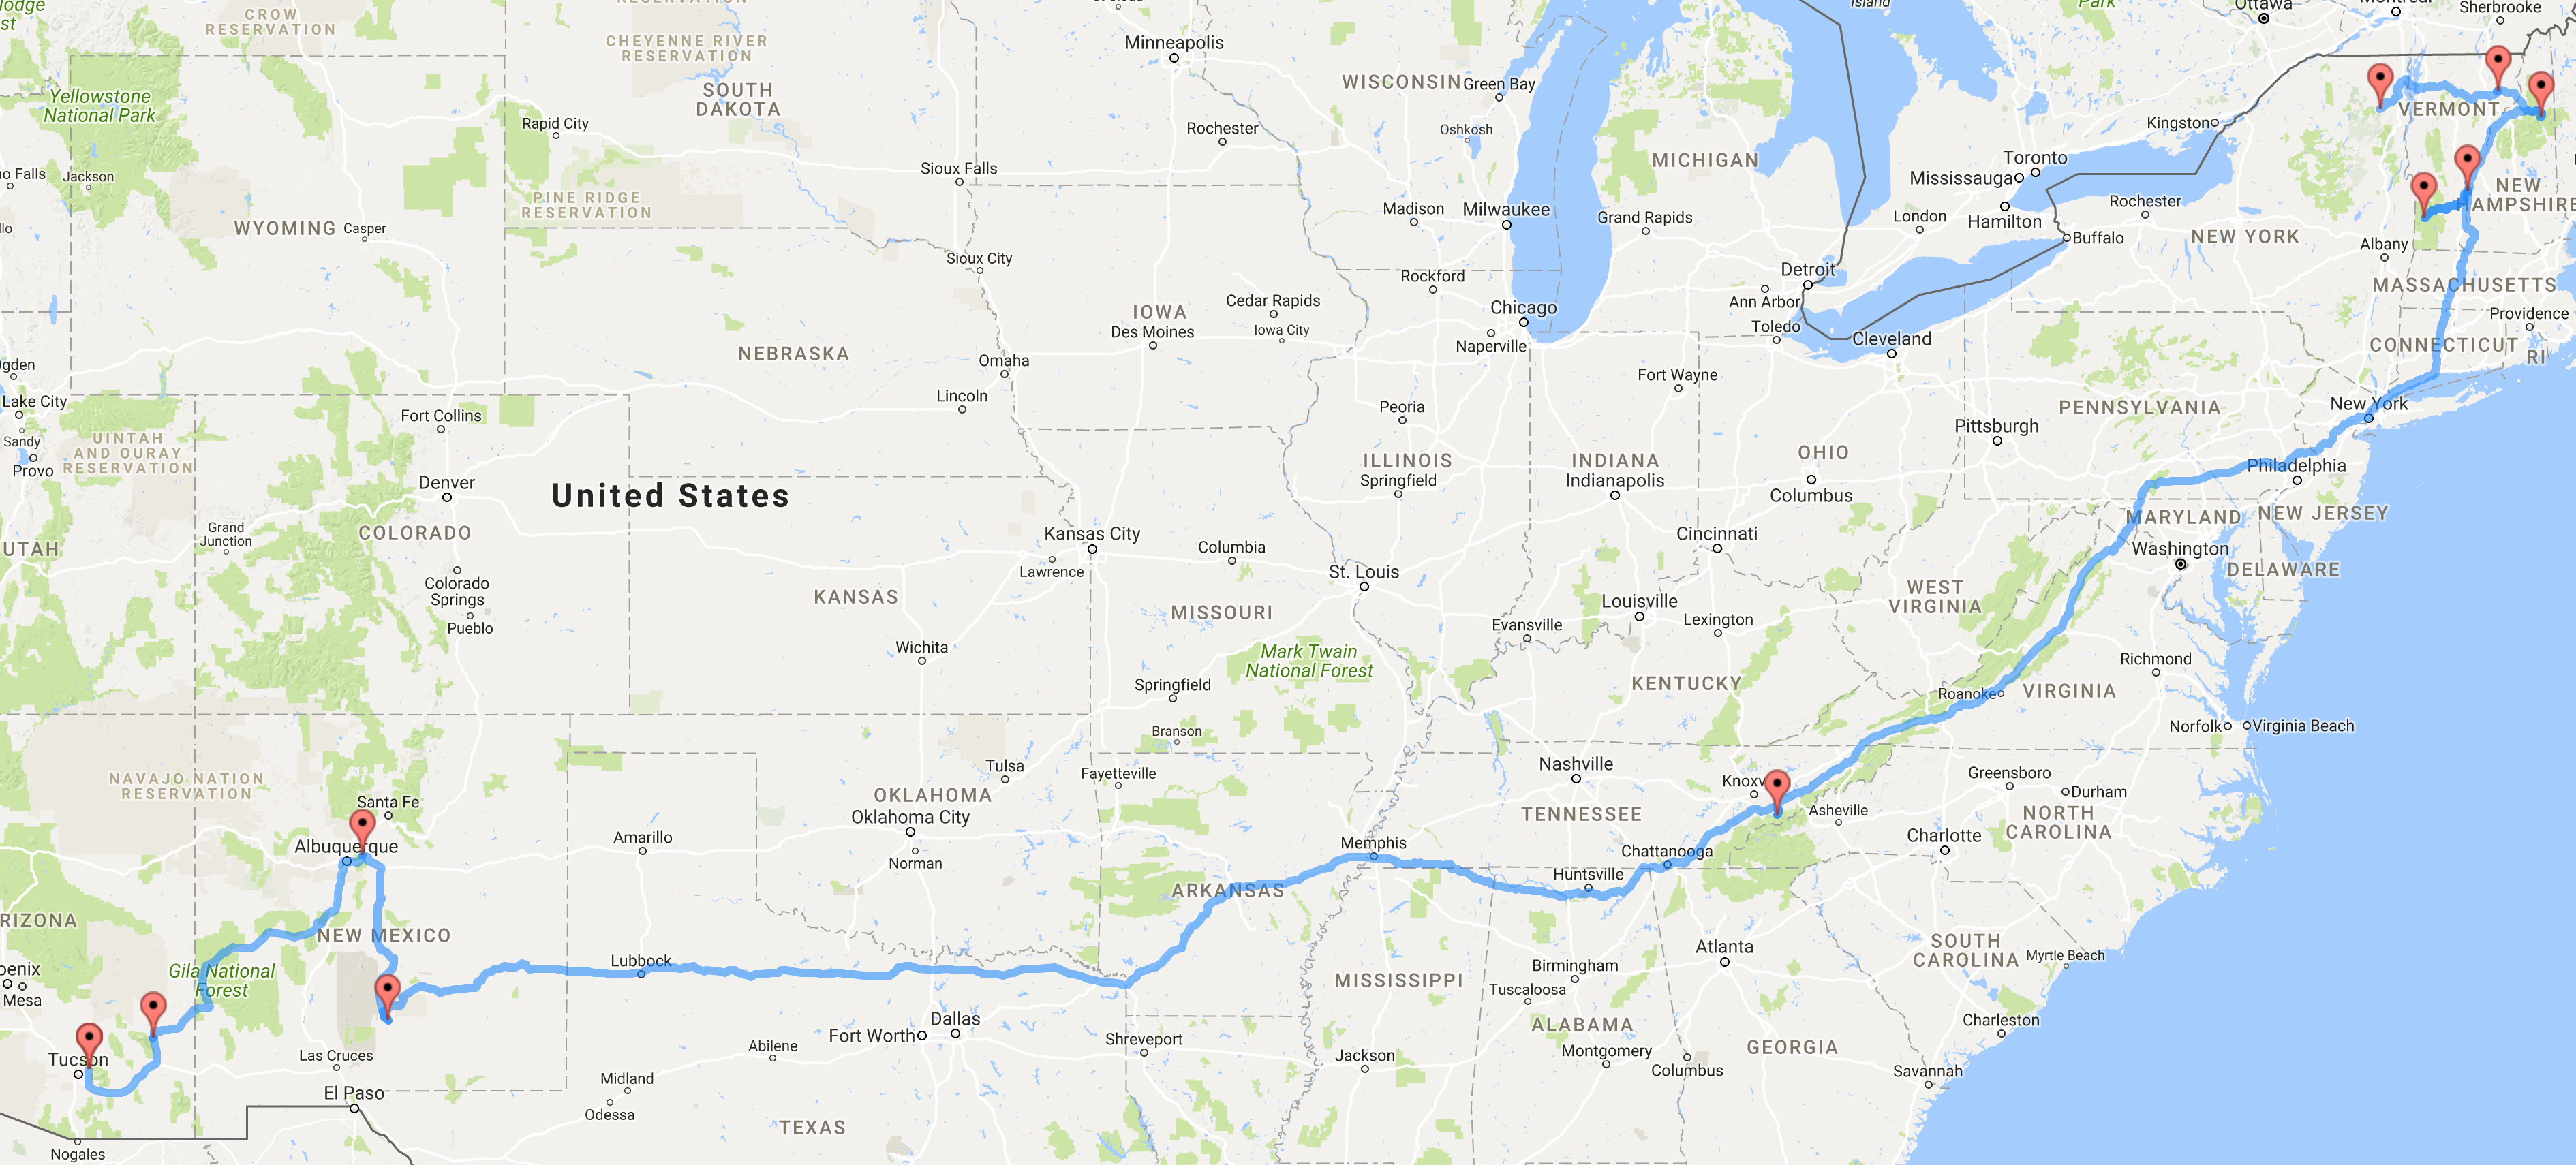
The final product is not a loop. This is completely intended. The output of the algorithm is a loop. I didn’t really like that, so I decided I would break it. Because I was breaking it, I could choose which pair of points didn’t need connection. Keeping in line with the original goal of the project, I removed the longest distance connection between any two consecutive points in the optimized path.
This turned out to be the connection from northwest Wyoming to upstate New York. I arbitrarily decided on the orientation of the route, which mean that upstate New York was the start, and that it would finish miles from the Wyoming/Montana border.
Drag on
I had a moment of realization as I was finishing up the manual route building of the ten original segments where I thought
“I’m going to have to drag the path to make all the hill climbs part of this route—that’s going to suck”
It did.
I used a timer during this project and this part of the project took approximately 8 hrs. This involved:
- downloading a chrome extension that can open lists of urls as tabs
- using my dataset of Strava segments to visually detail what the routes look like
- dragging a point just after the starting waypoint to the top of the climb
- adjusting points in-between to make sure they followed the exact path as the specified segment
- fixing some data issues again (yes, there were more at this point, c.f. below)
- adjusting the route between ends of climbs and starts of next to optimize both: enjoyability of ride, and minimal distance taking into consideration the different location
This last point was important to me. The genetic algorithm provides a pretty good global solution, but since I was effectively doubling the number of waypoints, and the algorithm never saw the new ones, there was only this human option.
This process was very challenging, and I had to spread this over a few weeks. In some cases, the route builder seemed insistant on not following the route I wanted and occasionally would require six or more extra points to force it. Not to mention the incredible frustration of summer roads. The astute reader may realize that we’ve been talking about mountains here, which in some cases, get snowy. In places like Colorado and some in the Sierras, the climb is on a summer road that I for the life of me, could not get ridewithGPS to plot on. However, again we see the flexibility of their tool: you can freehand.
So yes, dear reader, a few of the climbs are freehanded(poorly I might add).
More data issues
How could there be any data issues left by now? …Sigh…
In one case, I had apparently deleted a digit in the dataset accidentally. In two cases, the Strava segment listed was no longer listed on Strava. And more! These little issues eat up time and make an already exhausting task feel impossible. Nevertheless, I persisted.
Explicit changes to the dataset
Here is a short list of data changes that I made:
- A few climbs had double Strava segments
- Three climbs had bad coords for the starts: 44, 61, 62
- A few had no Strava segment listed, so I went and found some using the segment explorer
- Hwy 21-245-180-198 California, doesn’t have a Strava route, but there’s a longer one that can be used
- Tollhouse Rd had the wrong route number, it’s actually 9887218
- The Gibraltar Rd segment has been flagged, so I used the Gibraltar TT segment(shorter), but on the top 100 route, it still does the longer version
- Fixed the Lone Pine to Table Mountain segment to a better one
One for all
Now I had ten routes (1, 2, 3, 4, 5, 6, 7, 8, 9, 10), all with ten climbs each. Again, ridewithGPS to the rescue; combining was relatively painless. Although, I’ll admit that it’s a little hard on the browser to have close to 300 waypoints stretched over 14000 miles of route, unsurprisingly.
💯💯💯 So I guess, it’s time to show it to you!!!? 💯💯💯
^^^^^^ Click to explore the interactive route on ridewithGPS ^^^^^^
By the numbers
- 100 climbs in the Continental US
- 17 states
- 14235 miles
- 965210 ft of elevation
Some technical notes
- The dataset was extracted originally in November, 2017. I wont likely be updating the routes.
- The actual route doesn’t change as the ranking list changes, but, obviously, it will be effected if totally new routes are added.
- Bear Camp was not in the dataset when the original dataset was built, hence it’s not included. Here is the route. It should be in this section of the route, before you climb Mt. Ashland the Strava route for the new Bear Camp is here
- As of just yesterday, the pjammcycling website has changed dramatically. Additionally, they’ve expanded to worldwide now 😏.
Next Steps
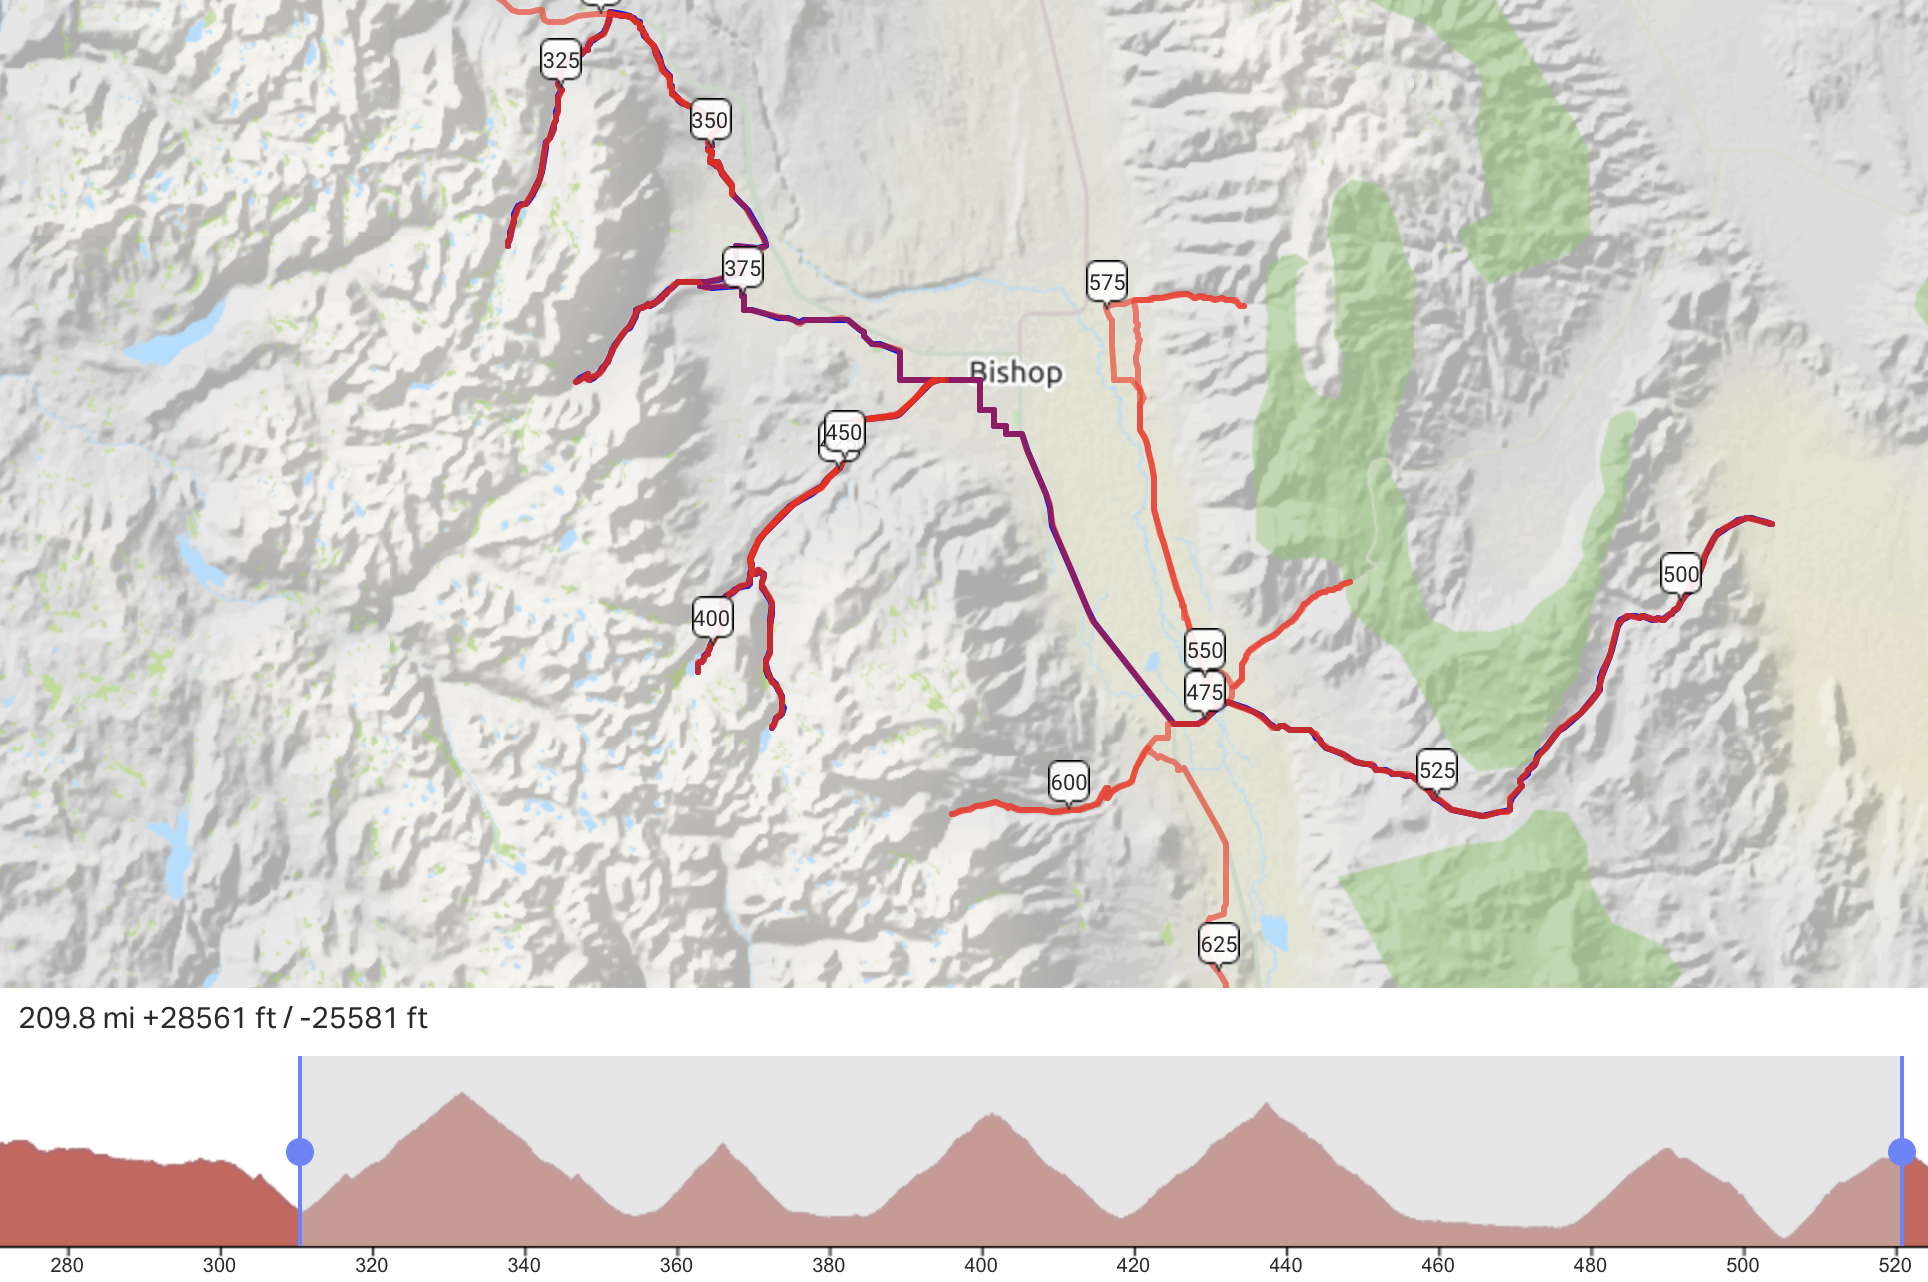
First, I want to mention an accidental offshoot of this project: maximal sub-routes. By this I mean, “what are some sections of this route which maximize the elevation/mileage trade-off?” These are things that you could consider turning into crazy Gran-Fondos like the California Triple Crown series which are hard-as-nails double centuries. There are some obvious ones in this data-set, and some manual inspection can find some cute little things like Mile 310-510 in the 4th route which contains almost 30k climbing on six of the top 100 climbs! (HRS I’m looking at you here!)
I’ll be following this post up with some fun dives into snippets like the above.
Finally, I want to mention that this project, believe it or not, is part one. To keep the mystery alive, I’ll only mention that part two is to compute the Best of the Top 100, and more generally a StraVaELO…
comments powered by Disqus